Completed by the National Network of Genomic Surveillance of the SARS-CoV-2 virus, operating under the coordination of EODY, the genomic analysis in 394 samples selected randomly or targeted and covering the period September 4, 2021 to November 5, 2021. of 394 samples, a total of 380 samples with variants Of Concern (VOC) emerged.
Of the 380 samples with strains of special interest, all relate to the Delta strain (Table 3). One of the 380 Delta executives concerns the strain ΑΥ.4.2, which was located in a case sample in the Peripheral Unit of Lassithi.
Since the launch of the National Network of Genomic Surveillance of the SARS-CoV-2 virus until today, a total of 35,648 samples of domestic cases have been tested in the country.
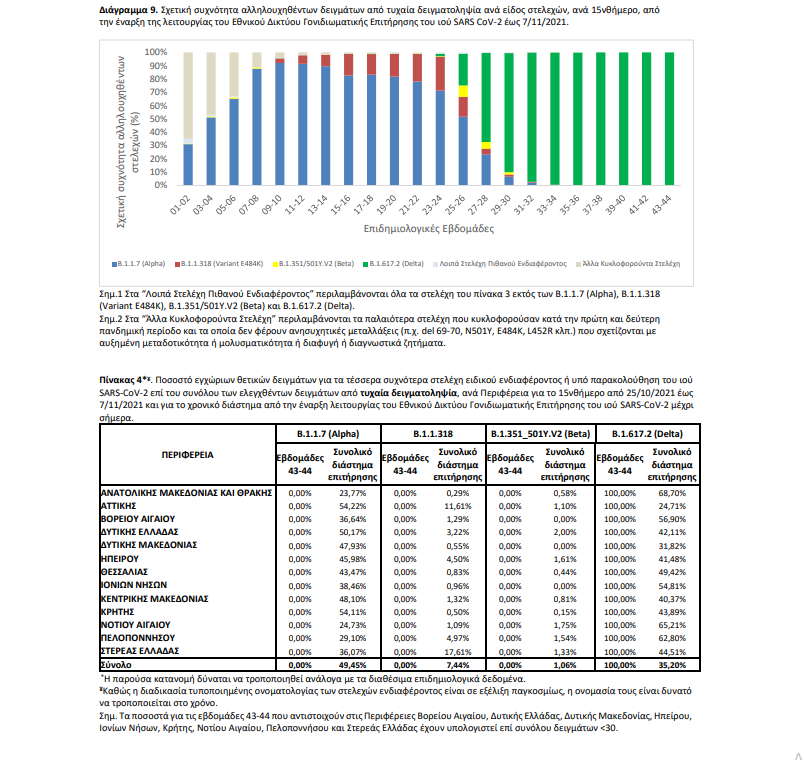
Of these, 31,473 come from random sample selection, 3,434 come from targeted sampling or sample selection, and for 741 samples the selection method is not available. Among the 31,473 randomly selected samples in the territory, the four most common strains of special interest or under surveillance that have been isolated are Alpha, with 49.45%, followed by Delta with 35.20%, B.1.1.318 (Variant E484K) with a percentage of 7.44%, and Beta with a percentage of 1.06% (Table 4).
The evolution of the relative frequency of random sampled samples by strain species by week up to week 44 is shown in Figure 9. Of the 3,434 samples taken or selected in a targeted manner, 3,270 strains of special interest or under observation were found.
Of these samples, 38.15% relate to B.1.1.318 (Variant E484K), 35.12% to Delta, 15.70% to Alpha, 5.88% to Beta, 0.12% to C.36 , 0.09% in Gamma, 0.09% in Eta and 0.09% in A.28.
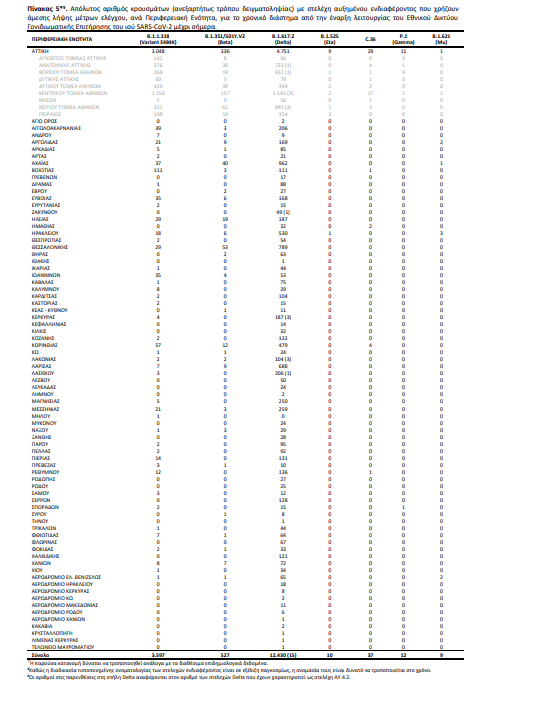
In addition, a total of 382 strains of special interest or under surveillance or interest have been isolated from samples of imported cases, of which 248 relate to Delta, 113 to Alpha, 7 to Mu, 6 to Beta, 4 to B.1.1.318 (Variant E484K) , 1 in Eta, 1 in C.36, 1 in Kappa and 1 in B.1.1 (Variant E484K). For stakeholders in need of immediate control measures currently in the country, the geographical distribution by Regional Unit is presented in Table 5.
.


