(News Bulletin 247) – Let’s stop for a moment on the combination of candles validated yesterday, firmly campaigning for a continuation of the ebb: a structure known as three black cords. The three black ravens are sometimes called “three-winged raven”, a term that comes from a Japanese expression saying that “bad news has wings”. This combination portends prices to fall if they appear at market highs or during an uptrend. Visually, the 3 crows are 3 black candlesticks, combining the following 2 characteristics:
1) All 3 candlesticks close at or near their lows. 2) Each open must be inside the body of the previous candle.
The structure is therefore fully validated and the thick and constant volumes on the three candles highlight its direction, in a market worried about the rise in long-term government bond yields. Next week’s FOMC will be closely followed in this respect, even if formally, the first increase in federal rates is not expected before the March deadline.
“Some Fed doves recently said they were surprised by the “high level and persistence of inflation”, in particular in connection with these global logistics tensions. Which ends up reinforcing the market’s conviction that the Fed will have to its monetary policy in a dynamic way”, retains Alexandre Baradez (IG France).
“It is therefore a much faster normalization of monetary policy than the previous one that will take place in the coming months. And the American markets have started to integrate this development since the beginning of the month with a rebound in rates and a decline in growth stocks and in particular technology stocks.
The stocks that are “paid” the most, namely mainly the solid records of American tech whose results are expected to increase in the long term, are in the front line when a stock market decline is brewing. This does not mean that the underlying bullish momentum is in jeopardy. But that the risks of correction are real, and that the amplitude of this correction must be assessed in the light of the initial advances…
Side values as a symbol, jointly, Peloton and Netflix crystallize these fears. The first with the announcement of the cessation of production of exercise bikes (which were the ultimate containment product) and the second with the disappointing publication of its annual results yesterday after the market. The subscription video-on-demand giant disappointed the market on its new subscriber growth last quarter. It is the first of the FANGAM to open the ball of results.
Peloton crashed 23.93% to $24.22 yesterday. The action exceeded in session on January 14, 2021, a little over a year ago, $ 171.
On the macroeconomic statistics side this Friday, nothing substantial to get your teeth into. Yesterday, weekly jobless claims for the week narrowly missed expectations at 286,000 new units, while the Philly Fed (Philadelphia Fed manufacturing index) rose to 23.2 points beating the target.
KEY GRAPHIC ELEMENTS
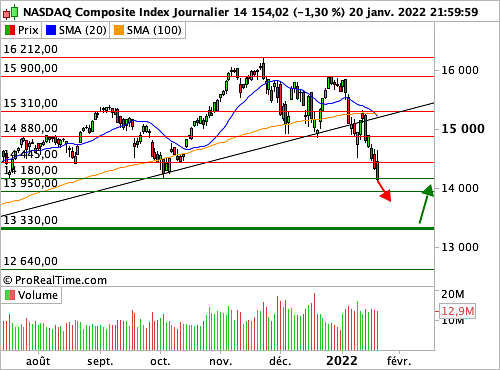
The oblique line symbolizing the underlying trend was broken, and after a pullback on January 12, the index started to fall again, with investors mobilizing throughout the session. A serious gap is now brewing, confirming entry into a corrective phase. Without a quick reintegration of 15,000 points, a gradual slide towards 14,180, then 13,330 points, would be the working matrix for the next few weeks.
PREVISION
Considering the key chart factors we have mentioned, our opinion is negative on the Nasdaq Composite index in the short term.
This bearish scenario is valid as long as the Nasdaq Composite Index is trading below the resistance at 14880.00 points.
CHART IN DAILY DATA

©2022 News Bulletin 247
Source: Tradingsat
I am currently a news writer for News Bulletin247 where I mostly cover sports news. I have always been interested in writing and it is something I am very passionate about. In my spare time, I enjoy reading and spending time with my family and friends.


